
Nutrition Ad Review: When Hook Rate and ROAS Disagree

You open the ad report. One video has a 38% hook rate. Another has 14%. The obvious move? Ask the team to make more videos like the first one.
Hang on. In this nutrition-brand report, the 38% video recorded four purchases and 0.88 ROAS. The 14% video recorded nine purchases and 2.47 ROAS. If you chose the next brief from the hook rate alone, you would be choosing from half the story.
We reviewed the supplied campaign report to turn that gap into a practical creative-testing process. Here is what the numbers show, what they leave unanswered, and how to write a better next brief.
By Nitin Mahajan · Last updated November 2026
What happened in this report
The report covers 25 January to 23 February 2026 for a nutrition brand. The two rows below are anonymised as Creative A and Creative B. These are reported campaign observations, not invented example results.
Hook rate, as labelled in the report
Creative A: 14%
Creative B: 38%Impressions
Creative A: 10,797
Creative B: 17,464Media spend
Creative A: ₹3,286.65
Creative B: ₹2,518.89Purchases
Creative A: 9
Creative B: 4Media spend per reported purchase
Creative A: ₹365.18
Creative B: ₹629.72ROAS
Creative A: 2.47×
Creative B: 0.88×
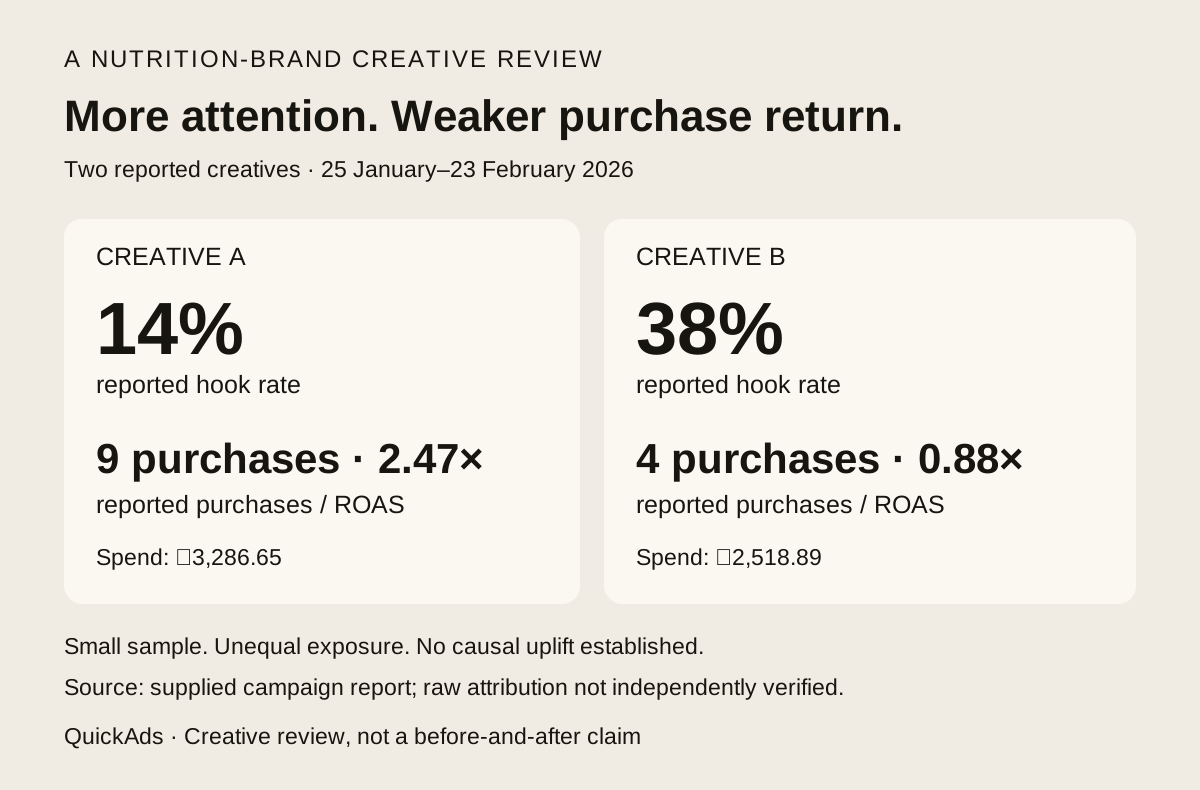
Source: supplied creative performance workbook, reporting window 25 January to 23 February 2026. Hook rate is the source's label; its raw denominator and attribution settings were not independently verified. Media spend per purchase is calculated from the reported spend and purchase count. Creator fees, rights and other campaign costs are not supplied.
The result gives us a reason to investigate. It does not show that a lower hook rate causes more sales. The ads had different spend and delivery, and purchase counts were small. The reporting window also does not mean each creative ran for 30 days.
1. Decide what the next video needs to do
“Get a better hook” sounds like a brief. It leaves out the business problem.
If the job is purchases, attention is one diagnostic. You also need to know whether the video reaches a relevant buyer, explains the product and gives that buyer a reason to act. Start the review with the decision: what evidence would justify commissioning the next batch?
For these two rows, the first decision is to inspect Creative A more closely, rather than dismiss it for attracting less attention. That is a review priority, not a budget-scaling recommendation.
2. Watch the whole argument before copying the opening
Open both videos. Write down the customer situation, product explanation, demonstration, supported proof, offer and call to action. Then check where viewers leave.
The workbook does not establish which of those elements explains the difference. We should not fill that gap with a story about a better creator, a stronger demonstration or a more authentic audience.
The useful output is a question you can test. For example: would explaining the product's use earlier improve purchase response? That is a proposed hypothesis, not a finding about these ads.
3. Check whether the comparison is fair enough for your decision
Before declaring a winner, inspect audience, placement, launch date, optimisation event, attribution window and destination. Check whether the reported purchases are mature enough to use. Keep any differences beside the result.
Here, Creative B had more impressions despite lower spend. That alone tells us exposure was not equal. It does not tell us why. Ask for the delivery breakdown before attributing the purchase difference to the opening or the person on screen.
AI can organise these records and flag missing fields. Someone still needs to open the source, watch the work and check the interpretation.
4. Put the actual bill beside the return
Creative A's ₹365.18 is media spend per reported purchase. Calling it complete customer acquisition cost would hide costs we do not have, and purchases are not necessarily unique new customers.
Likewise, 2.47 ROAS is not profit. Creator fees, usage rights, editing, internal work and product margin could change the commercial conclusion. Do not invent those inputs to finish the case study. Collect them before deciding what the campaign can afford.
Use the full-cost ROI guide to separate the reported media return from a modelled campaign return.
5. Turn the missing answer into one specific brief
Once the source videos and delivery settings are checked, choose one question worth the next spend. If it is product understanding, propose a version that explains the use earlier while preserving the offer and destination where possible. Record delivery differences rather than assuming they disappeared.
Agree the observation window, spend limit and decision rule before launch. Review purchases and cost alongside attention. If the sample is too small or delivery changes materially, record an inconclusive result. More production is not the only useful next action.
Open the next-test worksheet. It includes this reported case, a clearly labelled proposed test, and a blank record for your team. No sign-up is required in this review pack.
How QuickAds uses this kind of review
The QuickAds materials supplied for this project include creative analysis and proposed test briefs. This case applies that discipline: compare attention with business outcomes, expose what the report cannot establish, and make the next production request specific.
That is the difference a buyer should look for when evaluating AI-assisted creative work. A useful system helps you explain the next decision. A pile of additional video variations does not do that by itself.
Bring your next creative brief to QuickAds. Start with the customer, the intended demonstration and the evidence you need before committing to production.
Questions before the next decision
Does this case prove that a lower hook rate causes more sales?
No. The two reported rows had unequal spend and exposure, small purchase counts and unverified attribution settings. The contrast tells us what to investigate, not what caused the result.
Did the proposed follow-up test already run?
No. Explaining product use earlier is an example hypothesis for a next test. The report does not establish a completed follow-up test or a causal QuickAds uplift.
Keep the next decision connected
Continue with the ad creative testing guide and the creator workflow · influencer measurement.
About the author
Nitin Mahajan is the founder of QuickAds, which publishes this analysis and sells related software and services.









Privacy is important to us, so you have the option of disabling certain types of storage that may not be necessary for the basic functioning of the website. Blocking categories may impact your experience on the website. View Our Privacy Policy


