
What Is Cost Per Acquisition and How to Optimize It
Cost Per Acquisition (CPA) is the quiet pulse behind your marketing efforts. It answers one simple question: How much are you spending to land each new customer? Keep that number as low as possible, and you’re running an efficient campaign.
Cost Per Acquisition (CPA) boils down to total marketing spend divided by new customers acquired. A dip in that figure means you’re squeezing more value from every dollar.
What Cost Per Acquisition Means
Imagine you pour $200 into ads and, in return, 20 shoppers walk through your virtual doors. By splitting $200 by 20, you arrive at a $10 CPA. Instantly, you can stack that against other channels—whether it’s paid search, social media or email—to see which one stretches your budget furthest.
- Total Spend covers every cent dropped on ads, production and platform fees.
- Acquisitions track the conversions that matter: purchases, trial sign-ups or downloads.
- The Math is straightforward: Total Spend ÷ Acquisitions.
“CPA is where dollars meet customers.”
Here’s how Wikipedia frames customer acquisition cost:

Let’s zoom out and capture the essence of CPA.
Quick Overview of Key CPA Elements
ElementExplanationExampleTotal SpendMoney poured into ads and creative fees$200AcquisitionsNew customers or trial sign-ups20CPA FormulaTotal Spend ÷ Acquisitions$10
This snapshot distills the core pieces so you can spot opportunities at a glance.
Think of a small online store that invests $200 in a social campaign. When 20 new buyers sign up, dividing 200 by 20 delivers a $10 CPA.
- Record Total Spend: $200
- Count Acquisitions: 20
- Divide 200 by 20 → $10
That $10 number is your CPA—a clear, apples-to-apples measure of cost efficiency across any channel.
Why CPA Matters
CPA ties every marketing dollar directly to growth:
- It reveals whether you’re chasing genuine sales or just empty clicks.
- It highlights which channels deserve more—or less—of your budget.
With Quickads.ai, you can speed up creative testing and churn out fresh ad ideas in minutes. Rapid iteration often slashes CPA faster than traditional methods.
Key Takeaways
- CPA shows your average cost per customer.
- Even a 10% shift in spend or sign-ups can swing CPA dramatically.
- Comparing CPA across campaigns helps you funnel dollars into winners.
How To Use This Answer
Track your CPA weekly and refine your tactics against hard numbers. In the next sections, you’ll find formula tweaks, channel breakdowns and hands-on calculators to turn CPA into a strategic advantage.
Understanding Cost Per Acquisition
Marketing spend can feel a lot like planting seeds in a garden. Each dollar you invest aims to grow into a sturdy customer tree.
That gardening image shows why Cost Per Acquisition (CPA) matters far more than clicks or impressions. CPA ties your ad budget directly to real conversions, so you know exactly what each new customer costs.
The formula itself is straightforward but revealing. You divide your total marketing spend by the number of acquisitions. The result tells you if each “seedling” is worth the effort.
ComponentDescriptionExampleTotal SpendBudget for ads and fees$500AcquisitionsNew customers or sign-ups25CPASpend ÷ acquisitions$20
If you spend $500 in a month and win 25 trials, your CPA comes out to $20. If your garden isn’t budding fast enough, it’s a sign to tweak your watering schedule—aka your marketing channels.
Key Formula Variations
Sometimes your focus is on free trials instead of paid purchases. In that case, trial sign-ups become your acquisitions.
- Purchase CPA: Cost per completed sale
- Trial CPA: Cost per trial subscription
- Lead CPA: Cost per qualified lead
In the past eight years, customer acquisition costs (CAC) have jumped by 222%, forcing marketers to rethink budgets. Read the full research on CAC growth at Genesys Growth. Learn More About CAC Benchmarks
This snapshot shows CAC more than tripling, a clear signal that competition is heating up.
Common Missteps To Avoid
A frequent mistake is treating clicks as conversions. Without precise tracking, you can’t gauge campaign health accurately.
Always define what counts as an acquisition before you calculate CPA. Then:
- Set targets based on profit margins and customer lifetime value
- Measure CPA on a regular cadence
- Adjust bids whenever costs start to climb
- Leverage quickads.ai for rapid creative tests and meaningful data insights
- Calculate your current CPA baseline
- Determine your maximum acceptable CPA
- Monitor performance each week
- Tweak campaigns based on real results
CPA lets you cultivate growth by tying spend to real customer gains.
With this framework in place, you’ll track profitability more clearly and steer your campaigns toward a lower CPA.
Strategies To Improve CPA
Creative testing is your best friend for uncovering high-converting ads. At the same time, sharper audience targeting ensures you’re not wasting impressions.
- Run multiple ad visuals in parallel
- Shift bids toward your strongest performers
- Fine-tune landing pages with crystal-clear calls to action
- Retarget users who showed interest but didn’t convert
Pair precise targeting with quickads.ai’s rapid ad variations, and you can start cutting CPA in days, not months. The data will show which creative resonates and exactly when to reallocate budget.
As you nurture your marketing garden, keep an eye on each new customer tree, prune underperforming branches, and water the strongest shoots. With clear tracking, realistic goals, and agile ad creation, you’ll watch your CPA drop while your customer grove flourishes. Keep testing, refine messaging, and let data guide each planting decision daily. faithfully.
Comparing Cost Per Acquisition To Other Metrics
When you line up different marketing measurements side by side, you start to see which ones really drive growth. A simple Venn diagram can reveal how CPA, CPC, CPM, CAC, and LTV overlap—and where each one stands on its own.
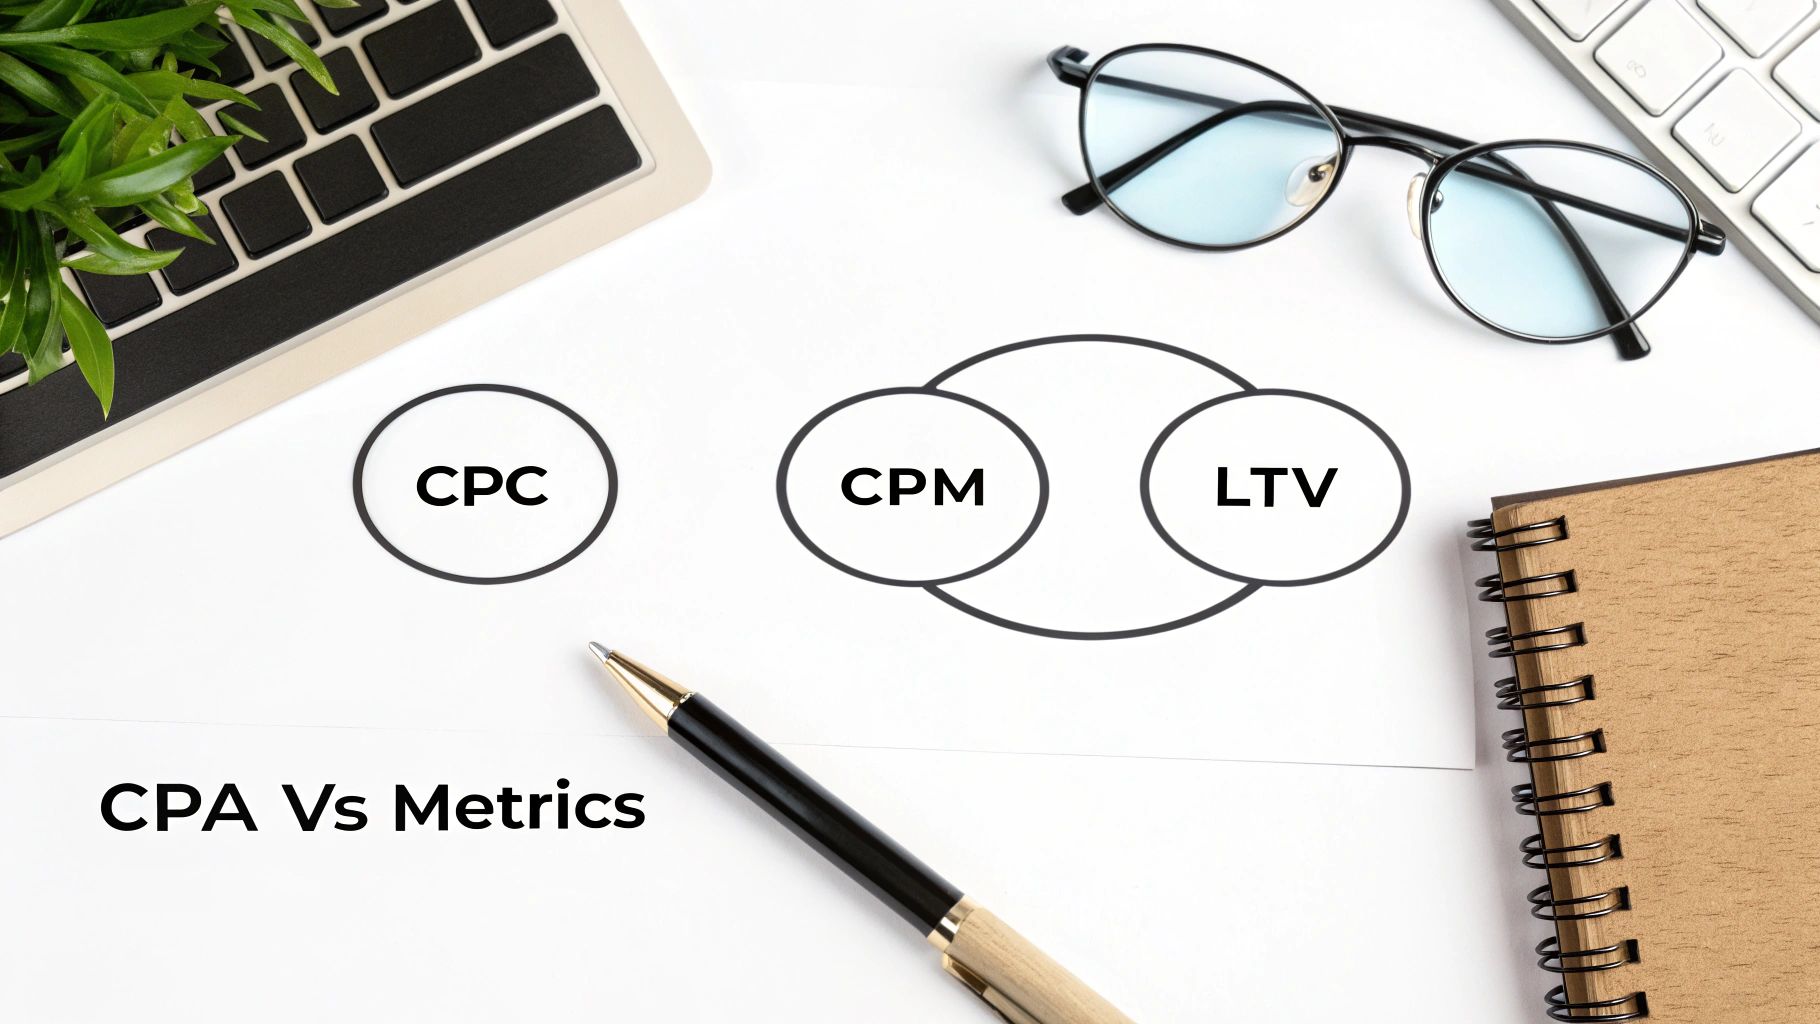
Think of CPC as the ticket price you pay each time someone clicks. CPM feels more like renting a billboard for every thousand views. Meanwhile, CAC covers all your marketing expenses to land a customer, and LTV sums up what that customer will spend over their lifetime.
- CPC (Cost Per Click) measures the cost of each site visit.
- CPM (Cost Per Mille) tracks spending per 1,000 impressions—perfect for brand awareness.
- CAC (Customer Acquisition Cost) rolls up every channel’s spend to show total cost per customer.
- LTV (Customer Lifetime Value) projects how much revenue each customer will generate long term.
When To Use Each Metric
Choose CPC to hone your bids and test keywords.
Lean on CPM when your goal is widespread visibility.
Watch CAC for the full-picture price of converting prospects.
Compare CPA across channels to see which delivers customers most affordably.
Refer to LTV to make sure your acquisition costs don’t eclipse future revenue.
“CPA often serves as the most direct insight into campaign efficiency because it ties spend directly to customer actions.”
- Marketing Strategist
In practice, you might layer these metrics—kicking off with CPM for exposure, then shifting to CPA to pinpoint which clicks turn into customers.
Real World Scenario
An ecommerce startup spent $2,000 on paid search and generated 200 purchases. That calculates to a $10 CPA. During that same stretch, their CPC hovered around $1.50 and their CPM averaged $12. By reallocating budget toward higher-intent keywords, they shaved 15% off their CPA.
MetricValueRoleCPC$1.50Cost for each site clickCPM$12Cost for 1,000 impressionsCPA$10Cost per purchaseLTV$45Projected customer value
Aligning each metric to a specific funnel stage helps you pick the right insight at exactly the right time.
Key Takeaways
- CPA ties every dollar spent directly to a customer action.
- CPC and CPM guide budget toward traffic and reach.
- CAC reveals the total cost of converting a lead.
- LTV keeps acquisition costs in line with long-term revenue.
Pair this framework with Quickads.ai’s rapid creative testing to drive down CPA and accelerate your ROI.
Metric Overlap Example
Imagine a push where a high CPM campaign builds brand lift, while low CPC ads drive clicks that convert, driving down overall CPA.
- Mixing metrics gives a clearer view across both awareness and conversion stages.
Now, pick the metric that fits your stage and objectives.
Evaluating Channels And Attribution Models
Each marketing channel carves its own path to acquisition, shaping your CPA in unique ways. Picking the right mix can shave costs and boost efficiency without magic tricks.
For a ballpark figure, e-commerce customer acquisition costs averaged $70 globally in 2025, though some regions pay far more than others. Read the full breakdown on LoyaltyLion’s site: Discover e-commerce CAC insights.
- Search Ads deliver intent-driven clicks at a lower CPA by matching real queries to your offers.
- Social Channels let you zero in on audience traits, but you often see a higher average CPA compared to search.
- Display Networks amplify your brand’s reach, though without solid retargeting the cost can climb.
- Affiliate Partnerships shift most of the risk—you pay only when someone converts, but commissions add up.
- Referral Programs tap into word-of-mouth; when incentivized right, they can be one of the cheapest acquisition routes.
Relay Race Analogy For Attribution
Picture your customer journey as a relay race. Every touchpoint hands off credit like a baton, and the way you divvy it up changes your CPA calculations.
Attribution models decide which runner gets the glory at each handoff.
- First Click awards full credit to the very first interaction.
- Last Click crowns the last touchpoint with 100% of the credit.
- Linear spreads credit evenly across all involved touchpoints.
- Time Decay gives heavier weight to the interactions nearest conversion.
Choosing The Right Model
Not all attribution models fit every funnel. A straightforward path might only need first or last click, while a complex journey calls for linear or time-decay insights.
- Sketch out every step your customer takes and assign a rough value to each.
- Decide which stages require the most visibility and allocate credit accordingly.
- Audit performance on a quarterly basis—tweaks are inevitable.
- Run multi-model reports to get a well-rounded picture.
For more on measuring across devices and digging into attribution nuances, check our deep dive: Complete Cross-Device Video Tracking Guide.
Shifting budget from a pricey channel to a leaner one can make a big dent in your numbers. In one case, moving funds from display to search slashed CPA by 20% within a few weeks:
Channel ShiftOld CPANew CPADisplay → Search$50$40Social → Referral$60$45
Ensuring Holistic Measurement
If you only look at one channel, you risk missing the bigger picture. Pulling search, social and offline data into a single dashboard gives you a real-world CPA that you can trust. If you want to skip building that dashboard manually, ppc analytics with claude ai lets you ask directly which channels are actually driving down your CPA.
Quickads.ai speeds up creative testing and churns out data-backed ad ideas in record time. Faster iterations mean you find your sweet spot and drive CPA down without second-guessing.
- Define clear conversion events before you set up attribution—nothing skews numbers like vague goals.
- Test different attribution settings in your analytics suite to spot any distortions.
- Split your budget into channel cohorts and run them side by side.
- Document every shift and its impact so you learn which mix really moves the needle.
By mapping channels carefully and choosing the right attribution method, you’ll see exactly what drives your customer costs. Blend those relay-race insights with Quickads.ai’s rapid ad production, and you’ll confidently shift budgets and keep driving CPA lower.
Mix attribution models and channel insights to reduce CPA continually.
Industry Benchmarks And Worked Examples
Before you dive into your own numbers, it helps to see how other industries are performing. The table below lays out the average cost per acquisition across key sectors.
Industry CPA Benchmarks
Description: Average cost per acquisition across key sectors
IndustryAverage CPAE-commerce$70SaaS$120Fintech$200Insurance$1,280
These figures span from $70 in e-commerce up to $1,280 in insurance.
Financial services face intense competition and long closing cycles, driving insurance CPA to the highest level. In alternative finance segments such as Private credit, where capital is typically provided through non-bank lenders and private debt structures, longer evaluation cycles and higher due-diligence expectations often translate into higher acquisition costs compared with consumer-focused financial products especially in niche weird wealth investment markets.
Worked Example For Online Retailer
Imagine an online store that spends $5,000 on paid social ads and records 250 completed purchases. By dividing $5,000 by 250, the resulting $20 CPA provides a clear line of sight on acquisition costs.
If the average order value sits above $25, that $20 CPA means the campaign is profitable.
- High-volume channels boost both impressions and purchases for scale.
- Over time, creative fatigue can push your CPA upward.
- Fresh ad variations often uncover more affordable wins.
Worked Example For SaaS Trials
A software provider allocates $3,000 toward free trial sign-ups and sees 150 sign-ups come through. The simple math—$3,000 ÷ 150—yields a $20 CPA for trial conversions.
Converting those trials into paying customers is where the real value appears.
- Monitor trial activation rates to optimize spending.
- Compare your trial CPA to the paid signup CPA for deeper context.
- Account for churn when mapping CPA to lifetime value.
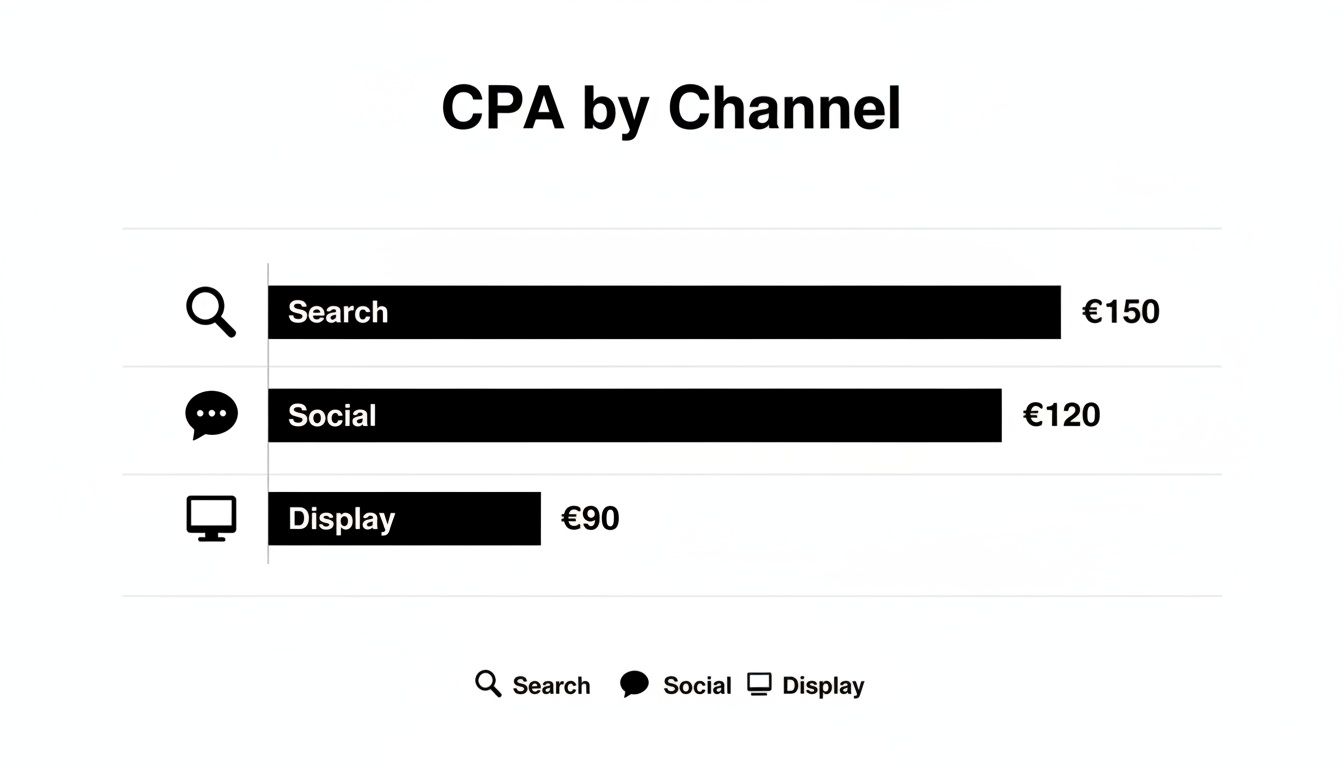
Search ads often lead the pack with the lowest CPA, while display campaigns tend to cost more on average.
Search CPA tends to be the most efficient because of clear intent matching.
Calculator Guide
Follow these steps to calculate your CPA accurately:
- Gather total spend across all campaigns.
- Count total acquisitions in the same timeframe.
- Divide Total Spend by Acquisitions.
- Compare your result against industry benchmarks.
This simple formula helps you avoid math mistakes and keeps everyone on the same page.
Common Pitfalls
Inconsistent timeframes between spend and conversions will skew your numbers. Failing to include offline sales can underreport your true costs.
- Mixing currencies without normalization leads to errors.
- Ignoring platform fees hides real expenses.
- Relying only on last-touch attribution distorts each channel’s impact.
Accurate attribution is half the battle in CPA calculation.
Interpreting Your CPA Versus Benchmarks
Once you have your CPA, set it against the table above. If you’re above the benchmark, consider these tweaks:
- Narrow your audience to focus on high-intent prospects.
- Rotate fresh visuals to combat performance decay.
- Shift budget toward channels delivering sub-$100 CPAs.
Using Quickads.ai’s rapid creative testing can shrink your CPA in hours rather than weeks.
Quick iterations are key to driving down your CPA over time.
Key Takeaways
- Benchmark your CPA against industry averages to find gaps.
- Real-world examples prove how the formula works.
- A clear calculator guide keeps your team aligned.
- Infographics illuminate performance differences.
- Quickads.ai accelerates ad testing to help you lower CPA faster.
Quickads.ai speeds up creative iterations and delivers data-driven ad ideas so you can lower your CPA more efficiently.
Actionable Strategies To Lower Cost Per Acquisition
Think of your marketing as an engine: every component needs fine-tuning. By focusing on the right levers, you’ll cut acquisition costs without shrinking your customer pipeline.
Here are six high-impact tactics to put into action:
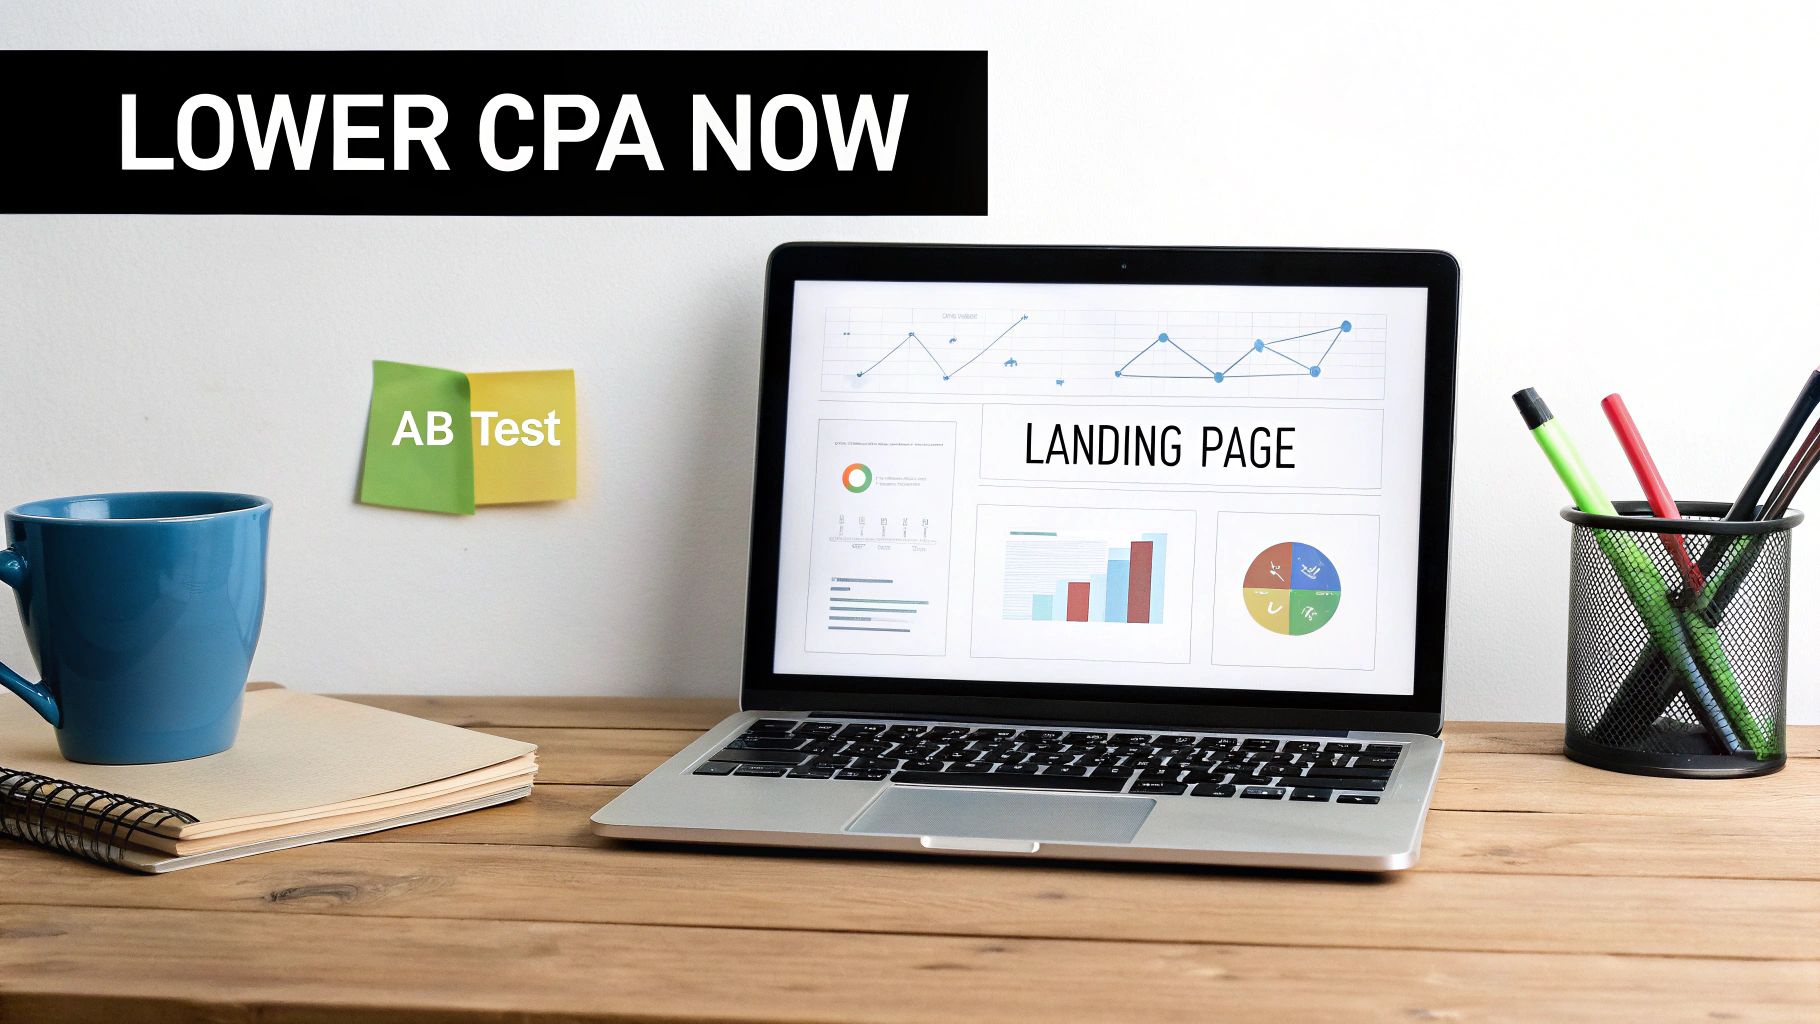
- A/B Split Testing: Run several ad variations at once to identify top performers.
- Lookalike Audiences: Reach people who mirror your best buyers.
- Bid Adjustments: Raise bids for high-converting time slots or segments.
- UX Refinements: Swap headlines, buttons or form fields to boost conversions.
- Sequential Retargeting: Lead prospects through a step-by-step ad journey.
- Monitor Competitor Pricing: Implement dynamic pricing strategies to stay competitive, so your traffic actually converts customers.
Testing Creatives For Better Performance
Small tweaks in your ad creative can yield outsized gains. One advertiser saw the CPA drop by 12% in just days after changing a call-to-action button from blue to orange.
A systematic A/B framework removes guesswork, so you know exactly which visuals and messages move the needle.
“When you test methodically, you don’t just hope for better ads—you prove them.”
Sharpening Audience Focus
Narrowing your targeting is like tightening a throttle: it propels you forward without wasting fuel. A boutique retailer cut their CPA by 18% after limiting ads to users who visited product pages twice.
- Define Your Ideal Customer around at least three core attributes.
- Filter Out Low-Intent Traits while including strong behavioral signals.
- Test Lookalike Segments at various similarity levels and compare results.
“Clear audience profiles prevent wasted spend and deliver messages to buyers who are ready.”
Optimizing Bids For Peak Efficiency
Bid strategies work like tuning a carburetor: the right mix drives performance. Automations can shift your spend in real time based on conversion likelihood.
- Target CPA Bidding: Set a goal CPA and let the platform aim for it.
- Enhanced CPC: Allow slight bid raises for clicks most likely to convert.
- Dayparting: Allocate more budget during your peak engagement hours.
“Adjusting bid rules is like tightening timing belts—tiny changes, big power gains.”
Improving Landing Page Conversions
A streamlined landing page smooths the path to purchase. By testing headlines, forms and load times, you’ll see direct effects on your CPA.
- Streamline Forms to collect only essential information.
- Add Urgency Cues such as countdowns or limited-time offers.
- Optimize Mobile Speed to load in under two seconds.
“Faster pages not only please users but also drive down acquisition costs.”
Reengaging Prospects With Smart Retargeting
Think of retargeting as a second lap to catch those who almost converted. Personalized follow-ups can lift conversion rates by 20% or more.
- Segment By Behavior (pages visited, time on site).
- Build Sequential Ad Flows that educate, remind and entice.
- Exclude Converters to avoid wasted impressions.
Putting It All Together With Quickads.ai
Quickads.ai speeds up creative testing, automates audience splits and keeps bids in line with your goals. Its data-driven ad generator produces dozens of variants tailored to your audience.
Check out our guide on reducing customer acquisition costs for deeper insights.
“Small adjustments, compounded over time, translate into substantially lower CPAs.”
Next Steps And Best Practices
- Monitor CPA Weekly and pivot immediately when costs spike.
- Pair CPA With LTV to balance acquisition efficiency and long-term value.
- Document Your Tests so you can repeat what works and discard what doesn’t.
Start optimizing today. Measure your impact daily and scale the tactics that deliver the biggest returns.
Frequently Asked Questions
Once you grasp cost per acquisition (CPA), you’ll naturally want clarity on calculations, attribution choices, channel differences, and tracking methods. These FAQs walk you through the essentials, step by step.
What Is Cost Per Acquisition And How Do I Calculate It?
Think of CPA as the price tag on each new customer. You simply divide your total marketing spend by the number of customers acquired.
- Formula: Total Ad Spend ÷ New Customers
- Example: $500 ÷ 25 customers = $20 CPA
This quick calculation reveals if your campaigns hit the mark or drain your budget.
How Do I Choose The Right Attribution Model For My Campaigns?
Selecting an attribution model is like giving credit in a relay race—you want to know who handed off the baton and who crossed the finish line.
- First-Click: Awards all credit to the earliest touchpoint.
- Last-Click: Honors the final interaction before conversion.
- Linear: Distributes credit evenly across every stage.
“The attribution model you choose determines which channels get the spotlight—and where you should reallocate budget.”
Attribution Models
Which Channels Typically Have The Highest CPA And Why?
Different ad channels play by their own rules:
- Display Ads
Cast a wide net but often capture low-intent audiences. - Social Ads
Engage curious users mid-funnel, driving awareness but not always conversions. - Search Campaigns
Target buyers actively searching—usually delivering the lowest CPA. - Affiliate Networks
Vary widely based on commission agreements and partner performance.
How Can Small Businesses Track CPA On A Tight Budget?
You don’t need expensive software to keep CPA measurements on point. Start with:
- Google Analytics for free traffic and conversion insights
- UTM Codes to tag every campaign link
- Simple Spreadsheets to log monthly ad spend and conversions
Block out time each month to audit your data, catch hidden fees, and ensure every lead is counted.
Ready to shave your CPA down with faster creative testing? Give QuickAds AI a try today.


Privacy is important to us, so you have the option of disabling certain types of storage that may not be necessary for the basic functioning of the website. Blocking categories may impact your experience on the website. View Our Privacy Policy


